How to Capture an Event Trace of the Verigio Network Filter Driver with
Performance Monitor
This article applies to the following products:
The Verigio Network Filter driver can perform real-time logging of its network
processing into a standard Windows ETL file. This logging may consume substantial CPU and
disk resources, depending on the logging flags and the level of detail. We recommend
consulting with our technical support to obtain the optimal logging parameters for your
hardware and software environment.
Real-time logging can be started and managed using the standard Windows program
Performance Monitor (perfmon.exe).
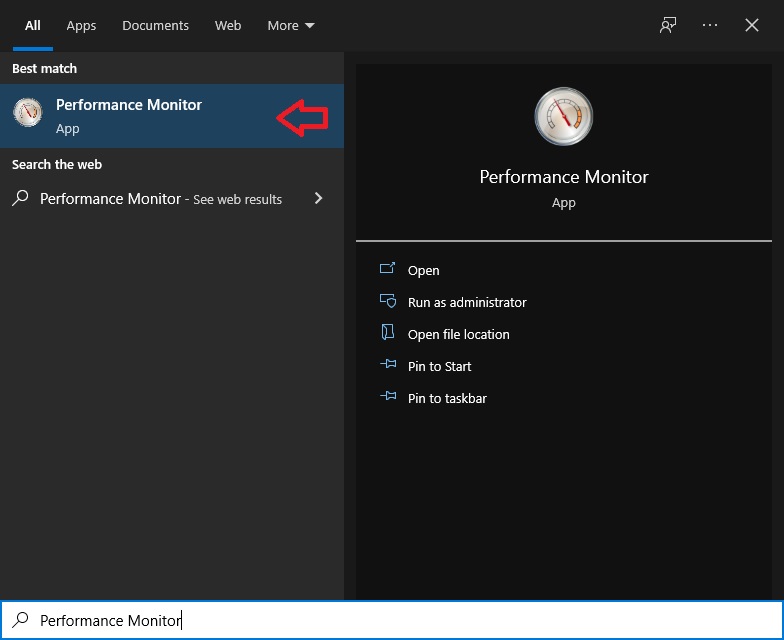
1. Start Performance Monitor.
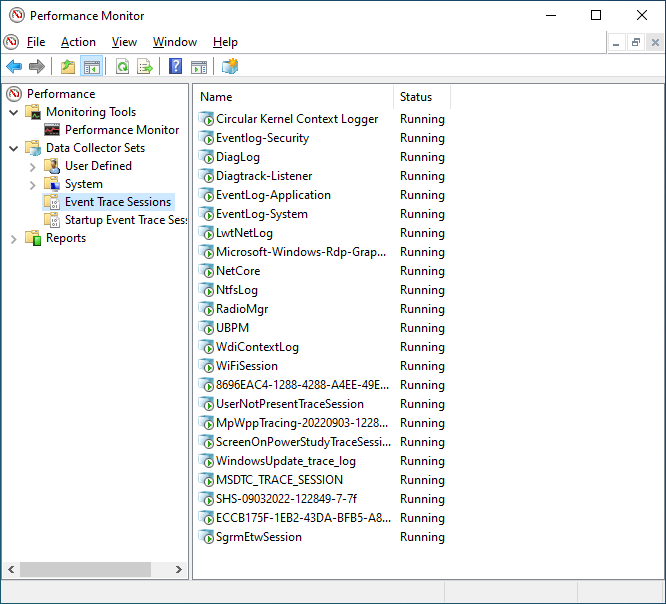
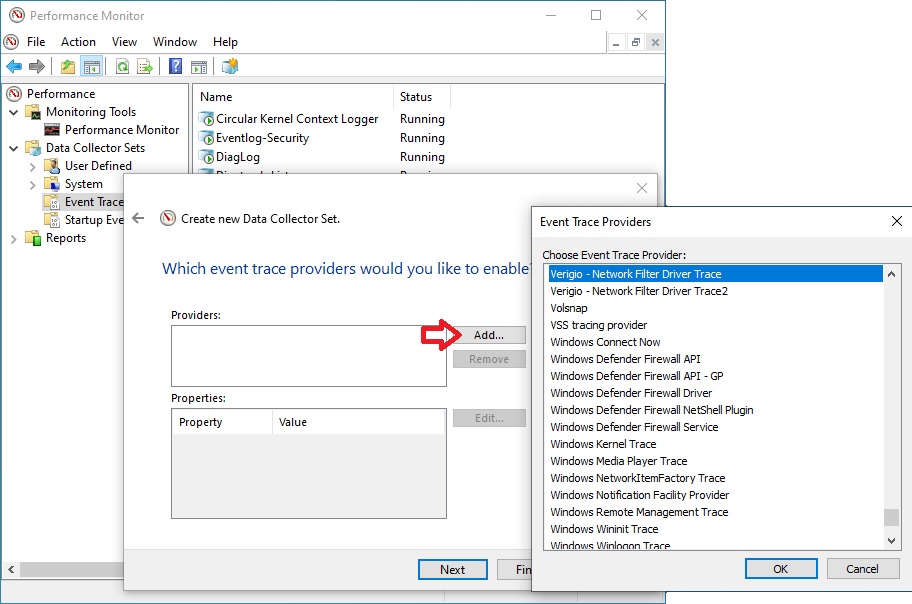
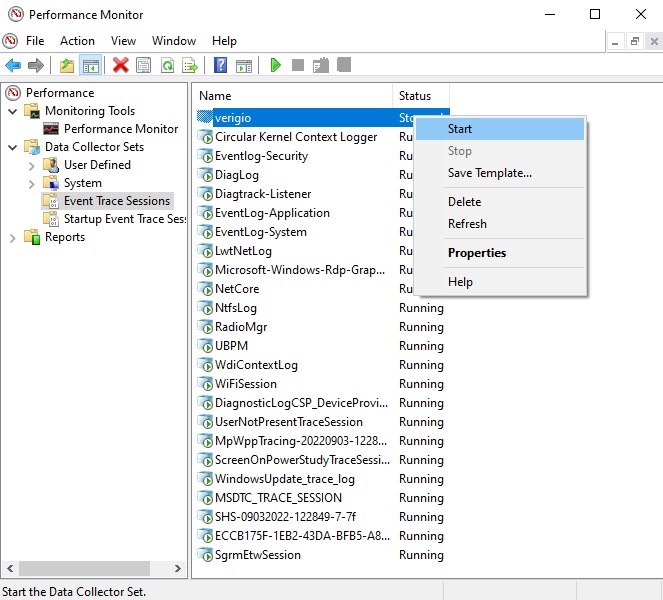
2. Select Event Trace Sessions node from the tree on the left.
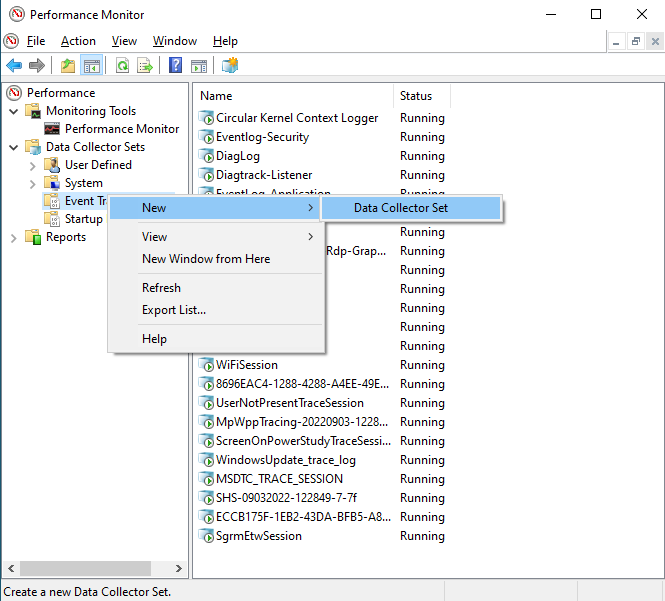
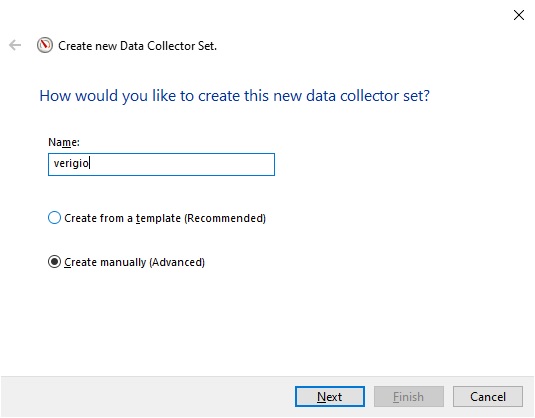
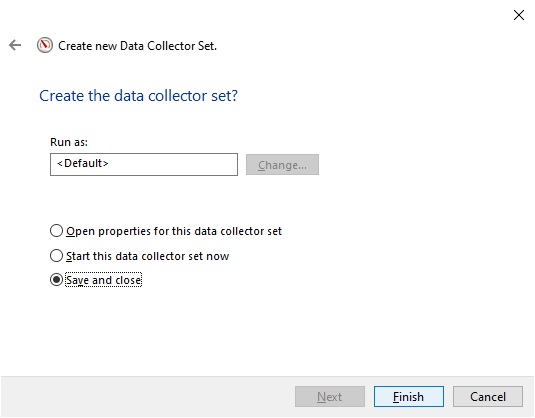
3. Create the new Data Collector Set named "verigio".
4. Add the "Verigio - Network Filter Driver Trace" and
"Verigio - Network Filter Driver Trace2" event trace providers.
Please note that these event trace providers are only installed as part of Verigio products.
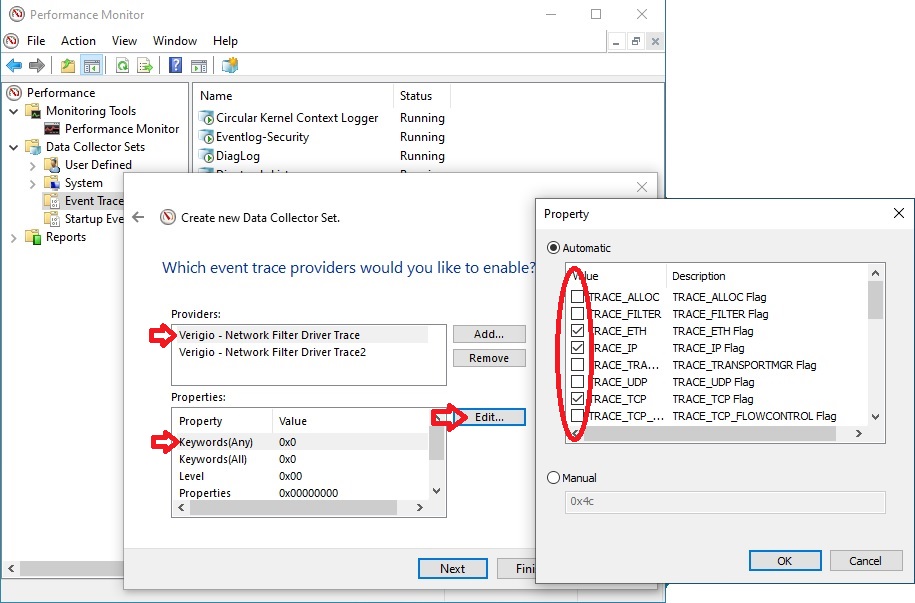
5. For each of the event trace providers, edit the
Keywords(Any) that select the event traces to be captured. These settings
significantly affect the size of the output log file. Please consult our technical
support to obtain the exact keywords for your specific logging needs.
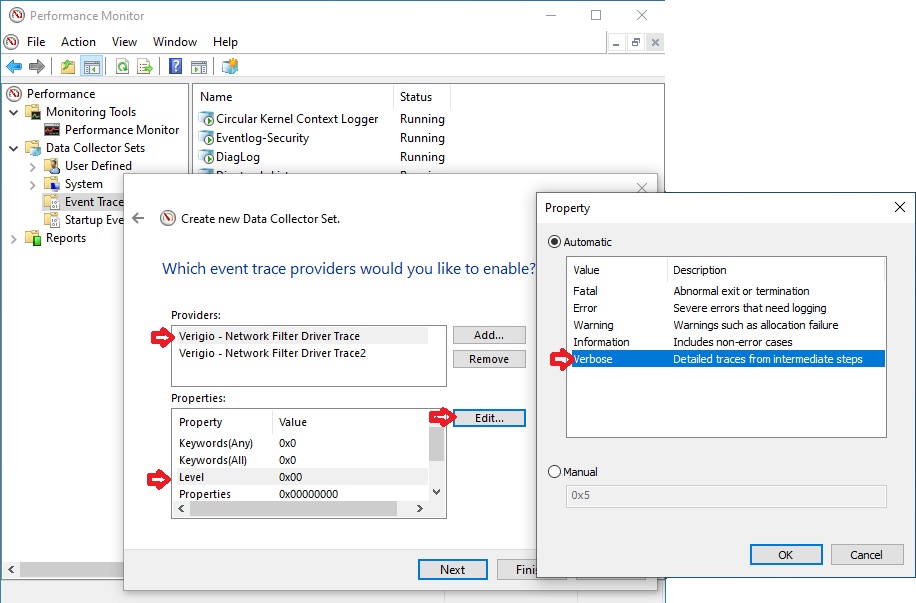
6. For each of the trace providers, edit the logging
Level. Set it to Information or Verbose.
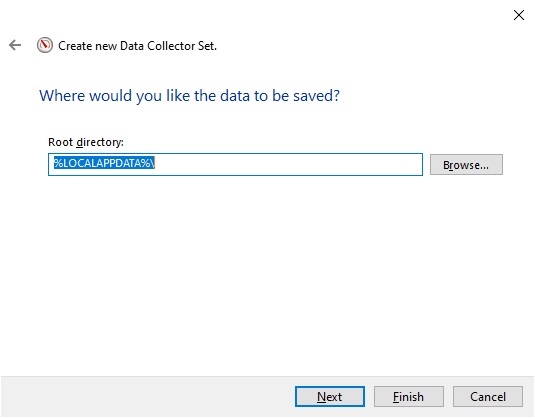
7. Select the log file location.
8. Save and close.
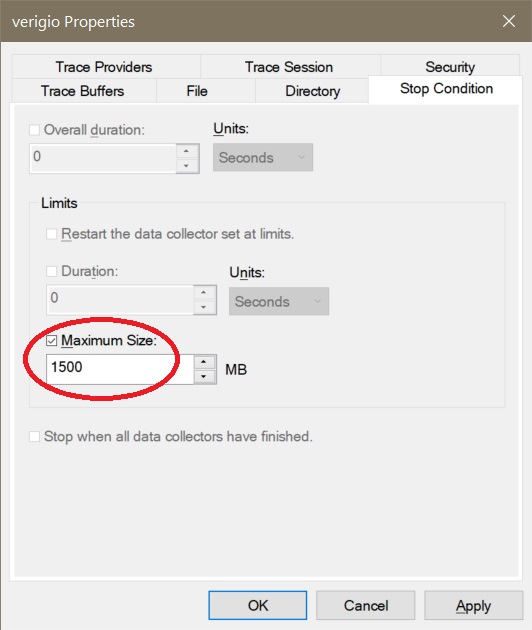
9. Adjust the properties of the new Data Collector Set.
Right-click on the newly created "verigio" Data Collector Set and select
Properties from the context menu. On the Stop Condition tab,
set the Maximum Size to 1,500 megabytes. This will limit the log file to 1,500
megabytes.
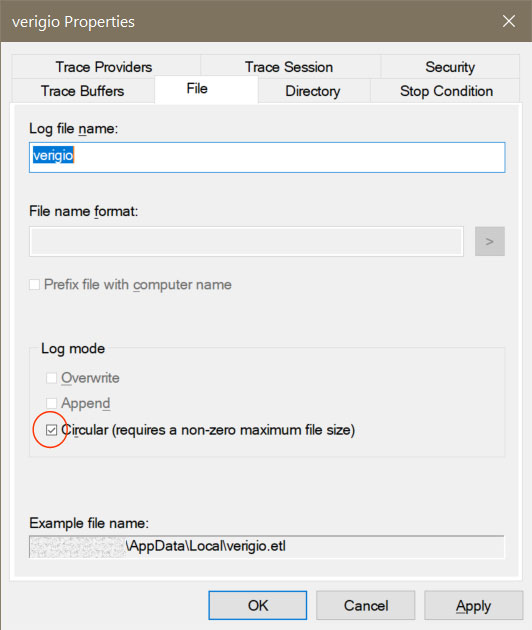
On the File tab, check the box next to Circular (requires a non-zero maximum
file size). This allows the log to continue recording when it reaches its maximum
size by overwriting the oldest log records.
10. Start logging.
Please note that this action begins voluminous real-time logging. Consider starting
it only after you are fully prepared to reproduce the network traffic for logging.
11. Once the needed network traffic processing has been logged, stop the
logging. The log file with the ETL extension (e.g., verigio.etl) is now
located in the folder specified in the "Select the log file location" step.
12. Contact our technical support to obtain the URL for the ETL file
upload that is specific to your support ticket.
Last updated: Oct 16, 2025.

 Shopping Cart
